

 Monitoring CPU usage, memory consumption, disk space, and other system metrics individually can quickly become difficult as you deploy more services. Grafana is an open-source visualization and monitoring platform that turns monitoring data into interactive dashboards, making it easier to understand system performance, identify issues, and track trends over time.
In this tutorial, you'll deploy Grafana OSS using Docker Compose on a BaCloud VPS running Ubuntu 26.04. You'll configure persistent storage for Grafana data, run the application in a Docker container, and set up secure HTTPS access using Nginx and Let's Encrypt.
Prerequisites
Before starting, make sure you have:
-
A BaCloud VPS running Ubuntu 26.04.
-
A user account with sudo privileges.
-
SSH access to the VPS.
-
A domain name pointing to your VPS public IP address (required for HTTPS configuration).
-
At least 2 GB of RAM and sufficient storage space for Grafana and its data.
Step 1: Update the System
Before installing Docker, update the package index and upgrade existing packages on your BaCloud VPS to ensure the system has the latest updates.
Update the package index:
sudo apt updateOnce the package index has been updated, upgrade the installed packages:
sudo apt upgrade -yStep 2: Install Docker Engine and Docker Compose
Grafana will run as a Docker container, so Docker Engine and Docker Compose must be installed on your BaCloud VPS before continuing.
If Docker is not already installed, follow our How to Install and Set Up Docker on Ubuntu 26.04 guide before continuing.
After the installation is complete, verify that Docker Engine is installed successfully:
docker --version
The command should return the installed Docker version.
Next, verify that Docker Compose is available:
docker compose versionThe command should return the installed Docker Compose version.
If both commands return version information, Docker is installed correctly and your BaCloud VPS is ready to continue with the Grafana deployment.
Step 3: Create the Grafana Project Directory
Create a dedicated project directory to store the Docker Compose configuration, environment file, and any other files used to manage your Grafana deployment.
Create the project directory:
mkdir ~/grafanaChange to the project directory:
cd ~/grafanaYou are now ready to create the Grafana configuration files for the Docker deployment.
Step 4: Configure Grafana with Docker Compose
Docker Compose uses a YAML configuration file to define and manage containers. In this step, you'll create the environment file containing the Grafana administrator credentials, then create the Docker Compose configuration used to deploy Grafana.
Create the Environment File
Docker Compose automatically loads environment variables from a .env file in the project directory. Create this file to define the administrator credentials Grafana uses during initial setup.
Create the environment file:
nano .envAdd the following configuration:
GF_SECURITY_ADMIN_USER=adminGF_SECURITY_ADMIN_PASSWORD=your_secure_passwordReplace your_secure_password with a strong password for your Grafana administrator account.
Save and close the file.
Next, restrict access to the file so that only the owner can read and modify it:
chmod 600 .envThe administrator credentials are now securely stored and will be loaded automatically when Docker Compose starts the Grafana container.
Create the Docker Compose File
Next, create the Docker Compose configuration that defines the Grafana container, persistent storage, networking, and startup settings.
Create the Compose file:
nano compose.yamlAdd the following configuration:
services: grafana: image: grafana/grafana:12.4.0 container_name: grafana restart: unless-stopped env_file: - .env ports: - "127.0.0.1:3000:3000" volumes: - grafana_data:/var/lib/grafanavolumes: grafana_data:Save and close the file.
This configuration deploys Grafana using the official grafana/grafana Docker image, loads the administrator credentials from the .env file, and stores Grafana dashboards, users, plugins, and application data in a persistent Docker volume. The service is bound to 127.0.0.1:3000, allowing Nginx to securely proxy external HTTPS requests to Grafana later in this guide.
Step 5: Start Grafana
Before starting Grafana, validate the Docker Compose configuration to ensure the compose.yaml file is correctly formatted.
Run the following command:
docker compose configIf the configuration is valid, Docker Compose will display the resolved configuration without returning any errors. You should see the grafana service and the grafana_data volume included in the output.
Next, download the Grafana image:
docker compose pullStart the Grafana container in detached mode:
docker compose up -dAfter the container starts, verify that Grafana is running:
docker compose psA successful output should show the Grafana container with a running status.
If you need to review the container output or troubleshoot startup issues, check the Grafana logs:
docker compose logs grafanaGrafana is now running on your BaCloud VPS and ready to be configured behind the Nginx reverse proxy for HTTPS access.
Step 6: Configure Nginx as a Reverse Proxy
To make Grafana accessible through your domain, configure Nginx as a reverse proxy. Nginx will forward incoming requests to the Grafana container running locally on port 3000.
Install Nginx
If Nginx is not already installed on your BaCloud VPS, install it with the following command:
sudo apt install nginx -yAfter the installation is complete, verify that the Nginx service is running:
sudo systemctl status nginx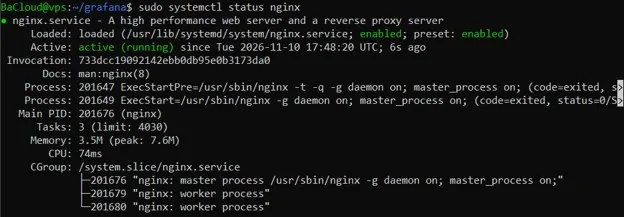
The output should show the service as active (running). Similar to the image above.
Create the Nginx Server Block
Create a new Nginx server block for your Grafana domain:
sudo nano /etc/nginx/sites-available/grafanaAdd the following configuration:
server { listen 80; server_name grafana.example.com; location / { proxy_pass http://127.0.0.1:3000; proxy_http_version 1.1; proxy_set_header Host $host; proxy_set_header X-Real-IP $remote_addr; proxy_set_header X-Forwarded-For $proxy_add_x_forwarded_for; proxy_set_header X-Forwarded-Proto $scheme; proxy_set_header Upgrade $http_upgrade; proxy_set_header Connection "upgrade"; }}Replace grafana.example.com with your own domain name, then save and close the file.
Enable the Server Block
Create a symbolic link to enable the configuration:
sudo ln -s /etc/nginx/sites-available/grafana /etc/nginx/sites-enabled/Before applying the configuration, test the Nginx syntax:
sudo nginx -tIf the configuration is valid, you should see output similar to:
nginx: the configuration file /etc/nginx/nginx.conf syntax is oknginx: configuration file /etc/nginx/nginx.conf test is successfulReload Nginx to apply the changes:
sudo systemctl reload nginxNginx is now configured to forward requests from your domain to the Grafana container running on 127.0.0.1:3000.
Step 7: Enable HTTPS with Let's Encrypt
After configuring Nginx as a reverse proxy, secure Grafana with HTTPS using Let's Encrypt. Certbot can automatically obtain the SSL certificate and update the Nginx configuration for your Grafana domain.
Install Certbot and the Nginx plugin:
sudo apt install certbot python3-certbot-nginx -yObtain the SSL certificate by running the following command and replacing grafana.example.com with your own domain:
sudo certbot --nginx -d grafana.example.comDuring the process, Certbot will request an email address, confirm the Let's Encrypt terms of service, and configure Nginx to serve Grafana over HTTPS.
After the certificate has been installed, reload Nginx to apply the updated configuration:
sudo systemctl reload nginxGrafana is now available securely over HTTPS. You can access it by opening your Grafana domain in a browser.
Step 8: Access the Grafana Web Interface
After HTTPS has been configured, open your Grafana domain in a web browser:
https://grafana.example.com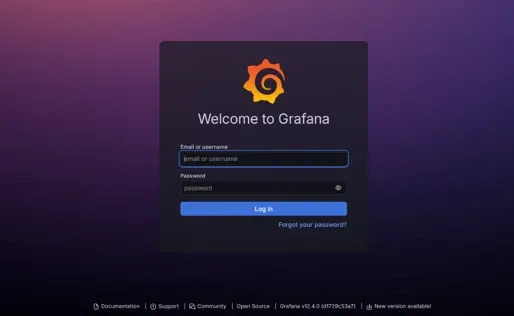
Sign in using the administrator username and password configured earlier in the .env file.
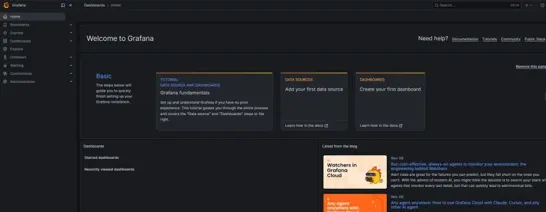
After logging in, you will be taken to the Grafana dashboard, where you can begin configuring dashboards and connecting data sources.
Conclusion
In this tutorial, you deployed Grafana OSS on a BaCloud VPS running Ubuntu 26.04 using Docker Compose. You configured persistent storage, deployed Grafana in a Docker container, published it through an Nginx reverse proxy, and secured access with a Let's Encrypt SSL certificate.
Your Grafana deployment is now ready to connect to monitoring data sources and begin building dashboards. To keep your deployment reliable, periodically update the Grafana container and back up its persistent data before upgrading.
For more in-depth tutorials, visit the BaCloud blog for helpful guides.