

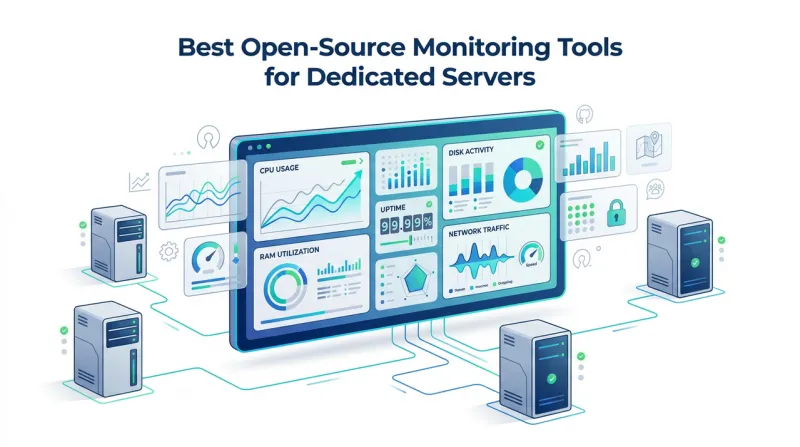
Running a dedicated server means keeping an eye on its health: Is it under heavy load? Is disk space running low? Are services still responding? Open-source monitoring tools help track these server activities and alert you when something needs attention, without adding licensing costs.
The tools differ in the features they offer and how much setup they require. Here, we look at five options and compare their features, strengths, and drawbacks.
1. Zabbix On-Premise
Zabbix offers several ways to install and run its monitoring software: Zabbix Cloud, public cloud vendors, Zabbix Containers, and Zabbix Appliance. For custom installations and monitoring setups, it also offers Zabbix Sources and Zabbix Agents. Zabbix On-Premise is the free, open-source solution for administrators who want to deploy and manage the software on their own infrastructure.
Zabbix packages are free to download and use in production. There are no licensing fees or limits on monitored hosts, devices, users, metrics, or alerts. Optional paid support subscriptions include guaranteed response times, technical assistance, and long-term maintenance.
Zabbix’s open-source solution supports several Linux distributions, including Alma Linux, Amazon Linux, CentOS, Debian, OpenSUSE Leap, Oracle Linux, Raspberry Pi OS, Red Hat Enterprise Linux, Rocky Linux, SUSE Linux Enterprise Server, and Ubuntu. Administrators can deploy it with MySQL or PostgreSQL and use Apache or Nginx as the web server.
Key Features for Dedicated Server Monitoring
-
Server resource monitoring
Tracks CPU utilization, memory usage, disk space, and network traffic to monitor dedicated server performance and identify resource bottlenecks.
-
Hardware health monitoring
Uses Intelligent Platform Management Interface (IPMI) sensors to monitor server hardware and S.M.A.R.T. attributes to detect potential physical disk issues. -
Agent-based and agentless monitoring
Collects server metrics using Zabbix agents or agentless methods such as Simple Network Management Protocol, SSH, and ICMP checks. -
Log monitoring
Monitors system and application logs, including Windows event logs, to identify errors, warnings, and other events that may indicate server issues. -
Customizable alerts and automated actions
Uses configurable thresholds to detect server issues, sends notifications through supported channels, and can execute predefined scripts or commands to address detected problems. -
Service availability and SLA monitoring
Organizes monitored services into a hierarchical service tree, tracks availability, and generates SLA reports against defined uptime targets. You can also set monitoring schedules and exclude planned maintenance from availability reports.
Pros
-
Free and open-source (no licensing fees, no monitoring limits).
-
Supports agent-based, agentless, and SNMP monitoring.
-
Offers customizable alerts.
-
Provides full control over the monitoring infrastructure and its data.
Cons
-
Initial configuration can be time-consuming (for complex environments).
-
Steep learning curve for configuring dashboards and monitoring rules.
-
Official support requires a paid subscription or partner services.
2. Prometheus
Prometheus is a fully open-source monitoring and alerting toolkit that collects, stores, and analyzes metrics from dedicated servers, applications, and services. The community maintains it, and it is a graduated project of the Cloud Native Computing Foundation (CNCF). All official components are released under the Apache 2.0 License.
Prometheus uses a modular architecture with separate components. The main server collects and stores time-series metrics. Node Exporter is a separate component that gathers server metrics, while Alertmanager handles alert notifications. You can install the components you need, but you’ll need to configure each one to build a complete monitoring environment.
Precompiled binaries and Docker images are available for most officially maintained components. The core Prometheus server supports Linux, Windows, and macOS (Darwin).
Key Features for Dedicated Server Monitoring
-
Server resource monitoring
Uses Node Exporter to collect CPU, memory, disk, filesystem, and network metrics from Linux and other Unix-like dedicated servers. Windows Exporter provides similar monitoring capabilities for Windows servers.
-
Multi-dimensional data model
Stores time-series data identified by metric names and key-value pairs (labels), allowing administrators to organize and distinguish metrics across dedicated servers, applications, and services.
-
Powerful PromQL queries
Provides Prometheus Query Language (PromQL) to query, correlate, and transform time-series metrics for analyzing server performance, creating visualizations, and defining alerts.
-
HTTP pull model and Pushgateway support
Collects time-series metrics through a pull model over HTTP. Pushing time-series metrics is also supported through an intermediary gateway called Pushgateway, primarily for short-lived jobs.
-
Service discovery and static configuration
Discovers monitoring targets through service discovery or static configuration, allowing administrators to define which dedicated servers, exporters, and services Prometheus should monitor.
-
Independent server operation
Prometheus server nodes are autonomous and do not rely on distributed storage. Each server can independently collect and store metrics using local storage.
-
Configurable alerting
Uses PromQL-based alerting rules to detect server issues. The separate Alertmanager component handles notification routing, grouping, and silencing.
-
Application and service monitoring
Prometheus can monitor applications and services running on dedicated servers using exporters. For example, exporters collect metrics from MySQL, HAProxy, and Memcached and make them available to Prometheus.
-
Graphing and dashboarding
Supports multiple modes of graphing and dashboarding, including built-in metric visualization and integration with Grafana for more extensive monitoring dashboards.
Pros
-
Fully open-source and community-driven, with all official components under the Apache 2.0 License.
-
The modular architecture lets administrators deploy only the monitoring components they need.
-
Powerful PromQL queries for detailed server performance analysis.
-
Extensive exporter ecosystem and integrations with tools such as Grafana.
Cons
-
Exporters, Alertmanager, and other components require separate installation and configuration, increasing setup and maintenance effort.
-
PromQL has a learning curve, particularly for administrators unfamiliar with time-series databases.
-
Built-in visualization is relatively basic compared with dedicated dashboarding tools such as Grafana.
3. Nagios Core
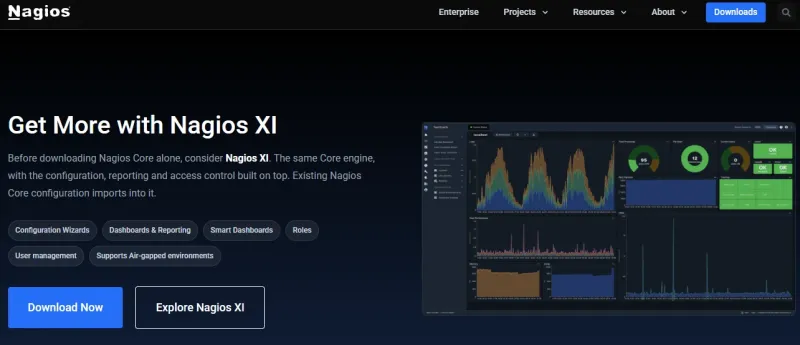
Nagios has two main monitoring solutions: Nagios Core, its free, open-source monitoring engine licensed under GPL v2, and Nagios XI, a commercial version built on the Core engine. Nagios XI adds web-based configuration, automated setup wizards, advanced dashboards, reporting, and professional support.
Nagios Core’s open-source monitoring solution includes three components: Nagios Core, Nagios Cross-Platform Agent (NCPA), and Nagios Plugins. Nagios Core is the main monitoring engine. It schedules checks, compares results with configured thresholds, and sends notifications when server or service states change. NCPA collects system metrics from Windows, Linux, macOS, Solaris, and AIX servers. Nagios Plugins provide checks such as check_ping, check_http, check_disk, and check_ssh. Together, these components monitor dedicated servers and their services.
Nagios Core is completely free to use, with no licensing fees. It uses text-based configuration files and supports more than 5,000 community add-ons, giving administrators ways to customize monitoring for their dedicated servers.
Nagios Core runs on Linux distributions such as Ubuntu, CentOS, Debian, and Red Hat Enterprise Linux. With compatible agents and plugins, it can monitor Linux, Unix, and Windows servers.
Key Features for Dedicated Server Monitoring
-
Server and host monitoring
Tracks processor load, CPU usage, memory and swap utilization, disk space, disk I/O, mount points, running processes, and system logs on Linux, Unix, and Windows dedicated servers. -
Network monitoring
Checks server connectivity and network services using TCP, UDP, ICMP, SNMP, HTTP, FTP, SSH, SMTP, and other protocols. Supports bandwidth monitoring, network discovery, and parent-host relationships to distinguish unavailable hosts from unreachable ones. -
Customizable alerts and notifications
Nagios Core can send notifications by email, SMS, or pager, or run a custom script to handle or forward an alert when an issue is detected or resolved. You can also set notification schedules and escalation paths, configure dependency rules, and enable flap detection for intermittently failing services. -
Event handlers and automation
Executes predefined actions when host or service states change, such as restarting a failed service. Supports parallelized checks, scheduled maintenance, log rotation, and redundant monitoring configurations. -
Plugins and extensibility
Includes more than 50 standard plugins and supports thousands of community plugins. Administrators can create custom checks in Bash, Python, Perl, C, PHP, and other languages, with remote execution through NRPE or SSH. -
Web interface and reporting
Provides a basic web interface for viewing server and service status, notification history, issue history, and monitoring logs. Supports availability reports, uptime and SLA tracking, and performance data export for graphing.
Pros
-
Completely free and open-source under GPL v2 (no licensing fees, no monitoring limits).
-
Highly customizable through thousands of community plugins and custom monitoring scripts.
-
Flexible alerting, escalation, and event-handling capabilities to detect and respond to server failures.
-
Supports Linux, Unix, and Windows server monitoring through plugins and remote monitoring methods.
Cons
-
Manual installation and text-based configuration make initial setup more complex than Nagios XI.
-
The web interface and reporting capabilities are more basic than Nagios XI's advanced dashboards and reports.
-
Scaling large monitoring environments may require additional configuration.
-
Bandwidth monitoring and some integrations may require additional tools or customization.
4. Checkmk Community
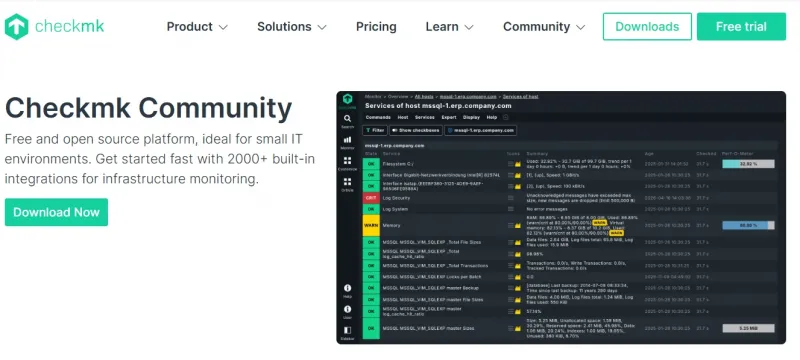
Checkmk offers four main editions: Checkmk Community, the free, open-source edition; Checkmk Pro, a commercial edition with advanced analytics, reporting, automation, and distributed monitoring; Checkmk Ultimate, which adds full-stack observability and advanced cloud integrations; and Checkmk Cloud, the fully managed SaaS offering.
Checkmk Community is the 100% open-source edition, designed for small IT infrastructures and personal projects. It provides more than 2,000 built-in monitoring integrations, and uses a lightweight, single-server architecture suitable for monitoring around 100 hosts. It is a standalone monitoring solution built around the open-source Nagios monitoring engine, with its own web interface, automatic service discovery, and configuration tools. Unlike the commercial editions, which use Checkmk's proprietary Micro Core, the Community edition relies on the Nagios engine and community support.
Checkmk Community supports dedicated server monitoring across Linux, Windows, macOS, and other Unix-like operating systems. It provides guided setup, automatic service discovery, and a web-based interface, making it relatively easy to configure server monitoring without building every check manually.
Key Features for Dedicated Server Monitoring
-
Server resource monitoring
Tracks CPU utilization, memory consumption, disk usage, disk I/O, running processes, filesystems, and network performance on dedicated servers. Provides metrics such as disk latency, input/output operations per second (IOPS), and bandwidth utilization to identify performance bottlenecks.
-
Agent-based and agentless monitoring
Uses lightweight native agents to collect performance and health metrics from Linux, Windows, and other dedicated servers. Also supports agentless monitoring through SNMP, IPMI, WMI, Redfish, and TCP/UDP, along with API-based checks using HTTP/XML, SSH, and Telnet. -
Automatic service discovery
Automatically discovers services and relevant metrics on dedicated servers, reducing the need to configure individual monitoring checks manually. Includes network mapping to help administrators understand server connectivity.
-
Web, database, and application monitoring
Provides more than 2,000 built-in checks and integrations to monitor applications hosted on dedicated servers, including Apache, Nginx, MySQL, PostgreSQL, Microsoft SQL Server, mail servers, and Java application servers. -
Service availability and response-time monitoring
Checks whether services hosted on dedicated servers, such as HTTP, FTP, SSL, POP3, IMAP, and SMTP, are available and responding correctly. Also monitors network latency and packet loss to detect connectivity problems. -
Server hardware and software inventory
Automatically discovers hardware and software information on monitored servers, helping administrators track installed components, identify outdated software, and review changes such as BIOS updates or RAM upgrades. -
Monitoring dashboards and performance visualization
Built-in dashboards show server health, resource utilization, and service status, helping administrators investigate performance problems and review monitoring data. -
Windows event log monitoring
Collects Windows Event Log information from Windows dedicated servers to help administrators identify system errors and investigate problems alongside performance and service metrics.
Pros
-
Completely free and open-source, with full access to the source code and control over monitoring data.
-
More than 2,000 built-in integrations reduce the need to develop custom server monitoring checks.
-
Guided setup and automatic service discovery simplify initial monitoring configuration.
-
Lightweight, single-server architecture suitable for small dedicated server environments.
Cons
-
Primarily designed for smaller environments of around 100 hosts; larger deployments may benefit from the commercial editions.
-
Advanced reporting, higher-performance distributed monitoring, and enterprise automation are reserved for paid editions.
-
Advanced configuration and custom check development can involve a steep learning curve.
-
Basic dashboards and limited historical availability reporting compared with the commercial editions.
-
Official professional support is not included; users rely on community support.
5. Netdata Community
Netdata provides an open-source monitoring agent and three main plans: Community (free); Business (starting at $4.50 per node per month); and Enterprise On-Premise (custom-priced for organizations that need a fully self-hosted monitoring platform). The paid plans add capabilities such as unlimited custom dashboards, extended data retention, advanced AI troubleshooting, and enterprise access controls.
Netdata Community provides free centralized monitoring for up to five active connected nodes, making it suitable for individuals and small dedicated server environments. It allows administrators to access dashboards remotely, view alerts across connected servers, and organize infrastructure into Rooms. It stores monitoring data on the servers rather than transferring it to Netdata Cloud for storage.
The underlying open-source Netdata Agent runs directly on monitored servers and collects metrics independently of the Cloud interface. It provides automated monitoring, per-second metrics, built-in dashboards, and alerting without requiring a separate monitoring database. This allows administrators to monitor individual dedicated servers locally, even without connecting them to Netdata Cloud.
Key Features for Dedicated Server Monitoring
-
Real-time server performance monitoring
Collects and displays metrics every second from dedicated servers, including CPU utilization, memory usage, disk activity, network traffic, and running processes. This helps administrators identify resource bottlenecks and sudden performance changes as they occur. -
Automatic monitoring setup
Installs through a single command and automatically discovers supported system components and services on dedicated servers. Generates monitoring dashboards and preconfigured alerts without requiring administrators to configure every metric manually. -
Built-in integrations
Offers more than 800 integrations to monitor server operating systems, databases, web servers, and applications. Administrators can use these integrations to monitor services running on dedicated servers alongside their underlying hardware resources. -
Automatic anomaly detection
Uses unsupervised machine learning on collected server metrics to identify unusual behavior. -
Preconfigured alerts and notifications
Provides built-in health alerts for server resources and services. This helps administrators detect performance issues and failures. The Community plan also supports centralized viewing of alerts received from multiple dedicated servers.
-
Automatic dashboards and visualization
Generates interactive dashboards for monitored server metrics, so you don’t have to build them yourself. The Community plan also lets you create one active custom dashboard per Room to view selected metrics across connected servers.
-
Lightweight, local monitoring
Netdata runs a lightweight monitoring agent directly on each dedicated server to collect and analyze performance metrics. It stores monitoring data locally, and the agent keeps monitoring the server even without a Netdata Cloud connection.
-
Centralized server monitoring
The free Netdata Community plan allows administrators to connect up to five dedicated servers to Netdata Cloud and monitor them from a single interface.
Pros
-
Free Community plan with an open-source monitoring agent and locally stored monitoring data.
-
Quick installation, automatic discovery, and preconfigured dashboards simplify monitoring of dedicated servers.
-
Per-second metric collection.
-
Built-in anomaly detection and health alerts help identify unusual server behavior.
-
More than 800 integrations support monitoring of server resources and hosted applications.
Cons
-
Community Cloud access is limited to five active connected nodes.
-
Only one active custom dashboard per Room is available on the free plan.
-
Advanced AI investigation, automated reporting, and some enterprise management capabilities require paid plans.
-
Extensive metrics and dashboards can overwhelm new users.
-
High-volume real-time monitoring can increase resource consumption and make dashboards demanding on less powerful systems.
Get Reliable Dedicated Server Hosting with BaCloud
Effective server monitoring starts with reliable infrastructure. With BaCloud's dedicated server hosting, you get dedicated hardware resources, full control of your server, and the flexibility to configure your hosting environment to meet your requirements.
Whether you're hosting websites, databases, or business applications, you can install compatible open-source monitoring tools to track performance, resource usage, and availability.
Explore BaCloud's dedicated server plans, choose the hardware configuration that fits your needs, and sign up today to get started.