

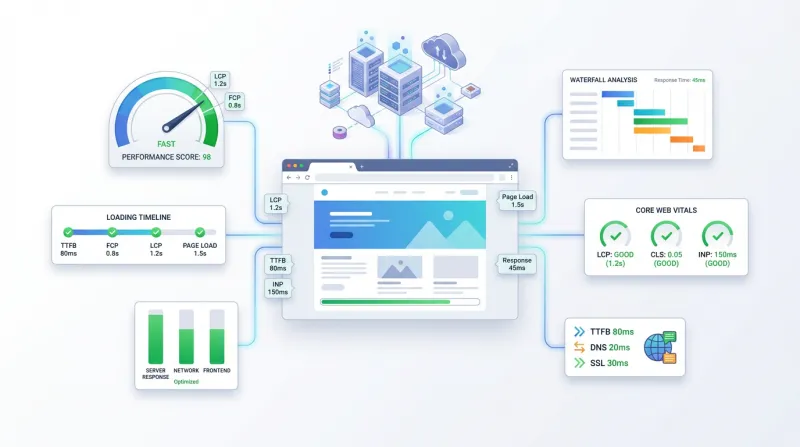
For website owners and developers, loading speed is critical. Slow pages frustrate visitors – many users will close a page if it doesn’t appear within a few seconds. In fact, studies found that even a one-second delay can cost a site roughly 10% of its traffic. Speed also affects SEO: Google now prioritizes fast-loading pages in search results. In short, great content alone isn’t enough; if a site is sluggish, users often hit the back button and end up on a competitor’s page.
To prevent these losses, developers use web-based speed-testing tools. These tools simulate page loads under various conditions (e.g., different devices and network speeds) to measure performance metrics like load time and Core Web Vitals. They then produce detailed reports (often including a waterfall chart) that show how each resource – images, scripts, fonts, etc. – contributes to the overall loading time. By identifying specific bottlenecks (for example, uncompressed images, heavy scripts, or slow servers), the reports offer actionable recommendations (such as minifying code or enabling caching) to help pages load faster. Faster-loading pages generally translate into better user experience and higher conversion rates, so regular speed audits are crucial for keeping a site performing well.
Google PageSpeed Insights

What it measures: PSI analyzes a URL on mobile and desktop. It reports Core Web Vitals (FCP, LCP, CLS, INP) using real-user CrUX data and Lighthouse lab metrics (including TTI, TBT, TTFB).
Key features: PageSpeed Insights gives a performance score and categorizes metrics into Good/Needs Improvement/Poor. It shows separate mobile/desktop results and comparisons to similar sites. It provides diagnostics and prioritized suggestions (e.g., reducing render-blocking CSS/JS and optimizing images) to improve scores.
Issues revealed: PSI flags slow-loading resources, excessive JavaScript/CSS, unoptimized images, slow server response, and layout shifts. It highlights “passed audits” (good practices) vs “opportunities” (improvement items) in a report.
Typical fixes: Common recommendations include using next-gen image formats (WebP/AVIF), minifying/combining CSS and JavaScript, enabling text compression, leveraging browser caching, and optimizing server response. These are not explicitly listed on the PSI page, but are standard web performance advice.
Pros/Cons: Pros: Fully free (no signup), Google-backed, uses both lab and real-world data, and integrates Core Web Vitals (important for SEO). Cons: It provides only one page at a time, no history or in-depth waterfall by default, and can yield variable scores due to variability in CrUX data. It also focuses more on Google’s metrics than complete page debugging.
Pricing/Access: Always free via pagespeed.web.dev (and an API).
Ideal use: Quick audit of mobile/desktop performance. Good for SEO-focused checks and benchmarking Core Web Vitals.
GTmetrix
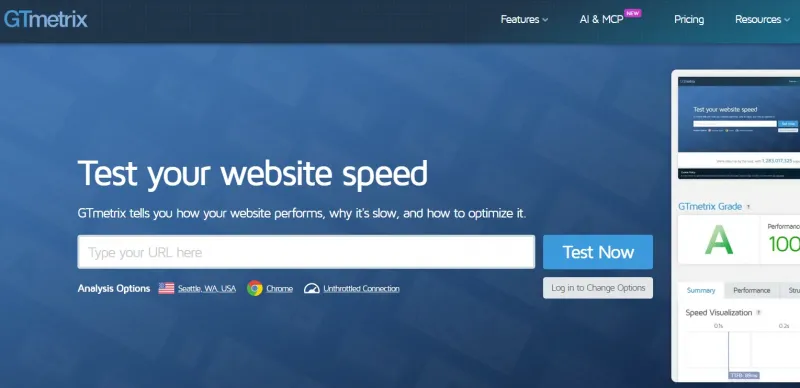
What it measures: GTmetrix runs tests using Chrome's Lighthouse and reports a full performance breakdown. It shows page load time, the number of requests, and Core Web Vitals (LCP, TBT, CLS), along with a waterfall chart and a filmstrip video of the load process. It includes both Lighthouse scores and historical real-user (CrUX) data for context.
Key features/metrics: GTmetrix’s report includes a “Performance” grade, a “Structure” score (like best practices), Core Web Vitals, and a list of resource sizes. It provides a detailed waterfall chart and a timeline filmstrip. It also lets you test on different devices (desktop/mobile) and locations (Seattle and London) on the free plan.
Issues revealed: It highlights exactly which files are largest or slowest, which resources block rendering, and which best-practice audits fail. It suggests fixes such as optimizing images, minifying CSS/JS, reducing server response times, and deferring unused code. For example, GTmetrix “provides concrete tips for reducing file sizes and improving page speed”.
Pros/Cons: Pros: Very detailed (per-file sizes, waterfall, video), combines lab and user metrics, can monitor pages over time, and supports test customization (throttling, private tests, etc.). Cons: Free usage is limited (typically 5 tests/month, only 2 test locations). More features (55+ devices, 25+ locations, frequent monitoring) require paid plans. Setting up an account is needed to track history.
Pricing: Free tier (basic account) with limited tests and locations. Paid “Pro” plans include many additional locations and devices, plus unlimited testing.
Ideal use: Developers and agencies needing deep analysis of page loads, multi-user monitoring, and actionable recommendations. Good for periodic auditing and regression testing.
SolarWinds (Pingdom)
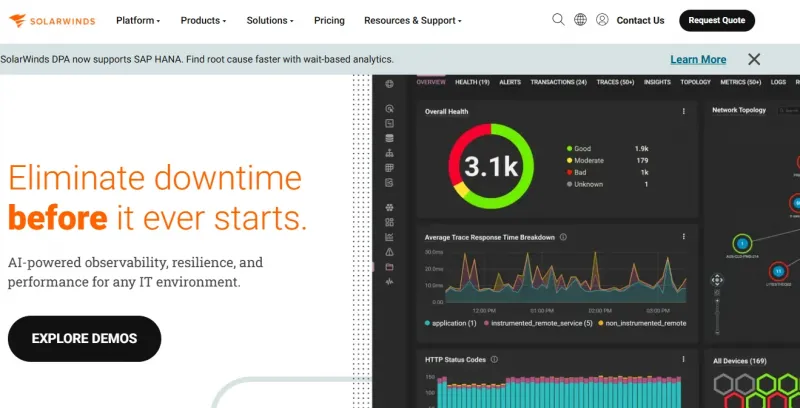
What it measures: SolarWinds (by Pingdom) loads a page and reports overall load time, file sizes and counts, and a performance grade. It also shows server response time, start render, and time to interact.
Key features/metrics: It runs tests from a global network (100+ locations worldwide). The tool identifies the largest or slowest elements (images, scripts, CSS, etc.) and assigns a performance grade. It provides a waterfall chart of all requests. Over time (with monitoring), it can chart trends and trigger alerts.
Issues revealed: SolarWinds highlights content-type bottlenecks. As one summary notes, “identifying whether scripts, images, or fonts are your most significant issue can help guide optimization”. It also reports if resources fail to load or take too long.
Typical fixes: Suggestions include compressing images, minifying code, optimizing the server (CDN, caching), and removing blocking scripts. (SolarWinds report will note missing expires headers, large images, etc., though these exact items aren’t directly quoted on the site.)
Pros/Cons: Pros: Global testing, detailed load breakdown, and ease of use (drag-and-drop tests). It offers filmstrip snapshots of loading progress. Free trial lets you test immediately. Cons: Full monitoring requires signup and payment after a 30-day trial. The free test alone is one-off (no history) and only from default locations.
Pricing: 30-day free trial for full monitoring, then paid plans for uptime and speed monitoring. The standalone speed test is free with no login.
Ideal use: Webmasters who want a quick test from different regions or ongoing site monitoring. Marketers might use the summary grade, while developers dive into the waterfall and resource breakdown.
LogicMonitor
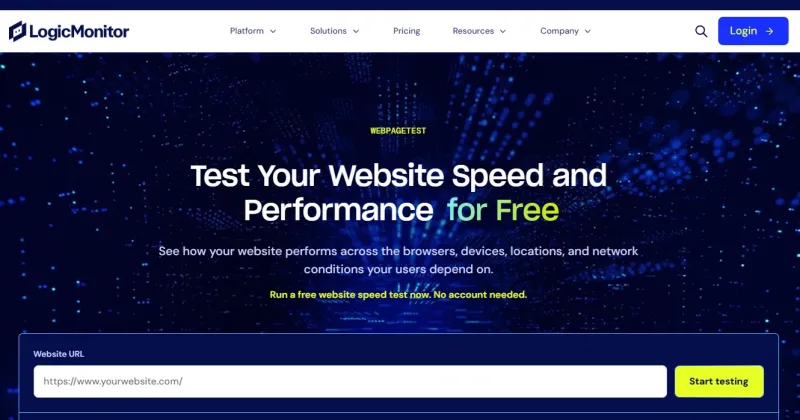
What it measures: LogicMonitor (ex WebPageTest) is a highly configurable, free tool. It runs real browser tests (Chrome and Firefox) across many devices, locations, and network speeds. It reports a full set of metrics (via Lighthouse integration): time to first byte, start render, Speed Index, Fully Loaded Time, LCP, and more. It also captures a filmstrip/video of the loading process.
Key features/metrics: LogicMonitor provides in-depth results, including a waterfall chart, filmstrip/PNG images of the rendering, and a summary of Lighthouse “Opportunities” (suggested optimizations). The free Starter Plan (no account needed) allows up to 150 tests/month from 30+ global locations and includes Lighthouse audits. The interface lets you script multi-step scenarios if needed.
Issues revealed: It pinpoints slow resources in the waterfall and highlights speed bottlenecks (e.g., long-running JavaScript, render-blocking CSS). The “Opportunities” section suggests fixes similar to those in PageSpeed Insights (compress images, leverage caching, etc.).
Typical fixes: Common findings include leveraging browser cache, compressing images, reducing payloads, and deferring or splitting JS. (These are similar to suggestions in PSI and GTmetrix reports, though not directly cited here.)
Pros/Cons: Pros: Extremely detailed and flexible. Supports real browsers, multiple test conditions (mobile CPU, 3G, etc.), and provides video playback. It’s free and open-source, with no usage limits other than rate limits. Cons: The interface can be complex. Interpreting results requires more expertise. (An account is optional but needed to save history.)
Pricing: Always free for the standalone test. LogicMonitor offers paid enterprise services beyond basic testing.
Ideal use: Performance engineers and technical users who need the “gold standard” of testing. Great for debugging complex scenarios and seeing exactly how pages load in the browser.
Uptrends
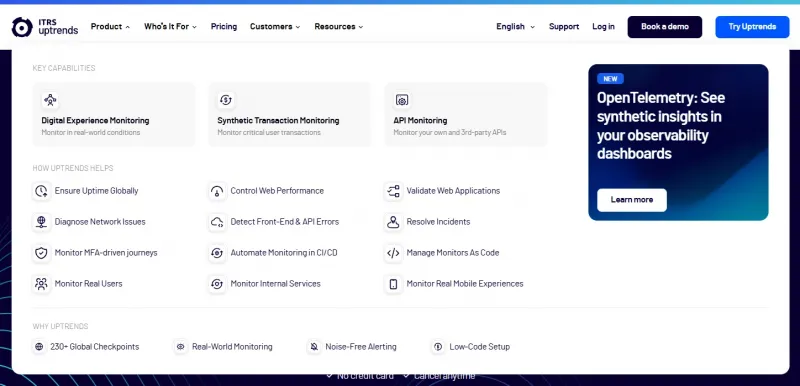
What it measures: Uptrends’ free Web Page Speed Test examines load performance in Chrome or Edge on desktop or mobile simulation. It records page-load metrics (TTFB, start render, fully loaded, etc.) and breaks down content types.
Key features/metrics: The report shows the total number of elements and page size by type (images, scripts, HTML, etc.). It then provides a waterfall chart with each element’s load time and header details. You can select a mobile viewport or throttle the connection to mimic real user conditions. Up to 10 global test locations are available in the free tool (expandable to 229 locations with a trial).
Issues revealed: The waterfall highlights any slow, failing, or blocking elements. For example, if a script or image stalls, it’s easy to spot in the chart. The test flags oversized scripts or images (by showing count and average size) and slow server responses.
Typical fixes: The tool includes “actionable performance tips from Google’s PageSpeed Insights”. It suggests optimizations like reducing redirects, compressing images, or enabling HTTP/2 as needed. Additionally, examining response headers can reveal caching issues.
Pros/Cons: Pros: Very user-friendly. No account is needed; results can be shared via a link. It uses up-to-date browsers (Chrome/Edge) and lets you easily compare Chrome vs Edge loads. It emphasizes element breakdowns and headers that marketers and developers can both understand. Cons: The free test only does one page at a time and one (or 10) locations. Advanced monitoring requires a paid account.
Pricing: Free single tests online; a 30-day trial unlocks all locations. Paid monitoring plans exist for ongoing checks.
Ideal use: Site owners and developers who want quick insight into both desktop and simulated mobile performance with element-level details. Good for those who value clear breakdowns and recommended fixes.
DebugBear
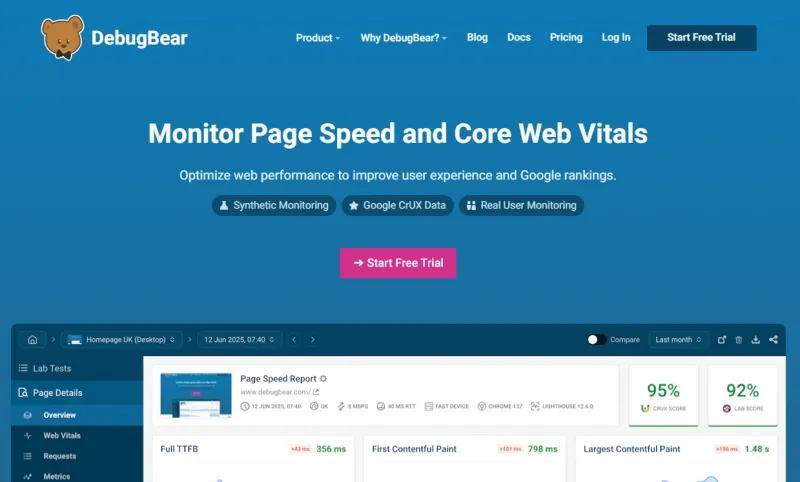
What it measures: DebugBear’s free speed test performs a comprehensive analysis that combines lab and real-user data. It measures Core Web Vitals (LCP, INP, CLS) both in controlled (Lighthouse) tests and via Google CrUX field data. It produces a full waterfall chart and captures page load visually.
Key features/metrics: The test highlights resources by size and load order, and you can watch the page load step by step (filmstrip). It also specifically checks the impact on third-party code. The report “detects over 25 common performance issues and provides the data you need to fix them”. It includes a full Lighthouse report for deeper audits.
Issues revealed: DebugBear flags issues like oversized HTML/CSS (which increase LCP), unoptimized images, render-blocking scripts, and slow third-party widgets. It reports both lab timings (from its simulated browser) and aggregated CrUX metrics, so you see both potential and actual user speed.
Typical fixes: It advises optimizing anything flagged—e.g., compressing large files, deferring or splitting JavaScript (reducing Total Blocking Time), and optimizing images with proper dimensions. It also recommends using caching headers and upgrading slow connections/components.
Pros/Cons: Pros: Modern interface with very detailed data. It claims “more accurate data than PageSpeed Insights, more in-depth reporting than SolarWinds, and real-user metrics you won’t find in GTmetrix”. You get Chrome DevTools-level detail in an easy UI. Cons: For continuous monitoring or advanced features, you need a paid plan. The free test requires JavaScript and may not run on old browsers.
Pricing: Free one-off tests (with no signup). Paid subscriptions enable monitoring across many global locations, access to historical data, alerts, and team collaboration.
Ideal use: Developers who want a modern alternative to traditional tools. Good for detailed debugging (e.g., analyzing third-party code) and comparing real user stats to lab results. Also useful for marketing teams that need clear, UX-oriented metrics.
SpeedVitals
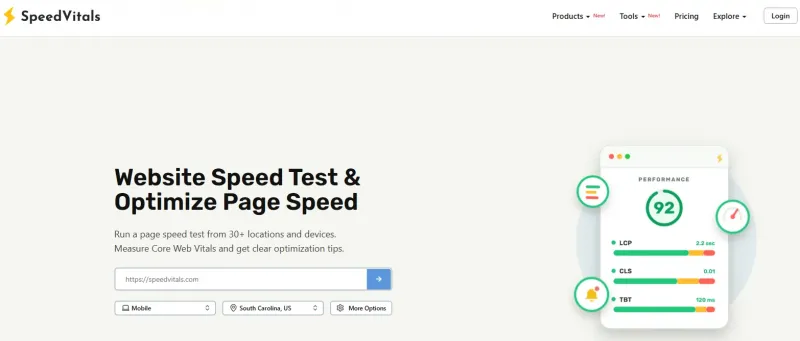
What it measures: SpeedVitals offers a free Page Speed Test focusing on Core Web Vitals. It runs a lab analysis under controlled conditions and measures LCP, TBT, CLS, along with supporting metrics (TTFB, FCP, Speed Index). The test is configurable (device type, location, network).
Key features/metrics: The report includes a waterfall chart showing resource timing, a Resource Summary (grouped by domain), and a Domain Map (network path). It explicitly calls out issues like “slow server response, oversized images, long JavaScript tasks”. Unlike some tools, it offers historical data tracking and competitor comparisons as premium features.
Issues revealed: SpeedVitals highlights exactly where delays happen. For example, a slow LCP might be traced to a large hero image or delayed TTFB; high TBT often comes from heavy JS execution. The report flags layout shifts (CLS) if images lack dimensions or ads load late.
Typical fixes: It suggests starting with the largest bottleneck (the largest LCP element or script). Common recommendations include adding width/height attributes to images, splitting long JS tasks, or moving non-critical scripts out of the initial load.
Pros/Cons: Pros: Free test with a modern interface. It shows both lab scores and field metrics (if available) and even a week summary for logged-in users. Additional features (alerts, multi-site monitoring, batch tests) are available in paid plans. Cons: The free tool may require a sign-up for tracking. As a relative newcomer, it has fewer user tutorials than legacy tools.
Pricing: Free instant tests (up to 50 in batch). Paid plans enable monitoring (weekly alerts and a 12-month history).
Ideal use: Developers and site owners who want an all-in-one tool emphasizing Core Web Vitals. Also fits teams wanting scheduled performance reports and comparisons.
Dotcom-Tools (Dotcom-Monitor)
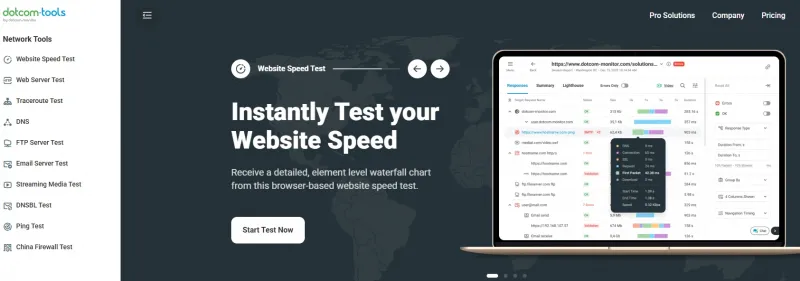
What it measures: Dotcom-Tools offers a free “Website Speed Test” among other free tools. It runs a simplified Google PageSpeed Insights check and reports basic loading metrics.
Key features/metrics: The test’s report includes a waterfall chart, average load times, and load speeds from multiple (about 22) global monitoring locations. It also provides a snapshot screenshot of the page and notes any errors. Because it uses a PageSpeed-based engine, it includes PageSpeed suggestions in a simpler format.
Issues revealed: It will flag obvious slowdowns (large images or scripts) and highlight any HTTP errors. The waterfall and multi-location timing table help spot latency problems or global slowness. However, it covers only a subset of Core Web Vitals (focusing on load time metrics).
Typical fixes: Since it leverages PageSpeed Insights, common advice (optimize images, minify code) is included. The tool’s report explicitly shows if the site fails any basic checks (e.g., no HTTPS, large files).
Pros/Cons: Pros: Completely free and quick. It’s good for a fast check of server response and basic front-end speed. Cons: Limited scope – it covers fewer performance metrics than most tools. The interface is more utilitarian. It’s mainly useful if you already use Dotcom-Monitor’s suite of tools.
Pricing: Free. (Dotcom-Monitor sells a separate paid monitoring platform, but the free tools require no account.)
Ideal use: Small business owners or IT teams needing a quick, multiple-location load test. It’s a lightweight supplement to other tools, not a full-featured analyzer.
Conclusion
Regular speed testing is essential. The above tools make it easy to pinpoint slowdowns and get fix suggestions. For best results, use multiple tools: for example, check Core Web Vitals on PageSpeed Insights, then drill down into resource issues with GTmetrix or LogicMonitor. Ultimately, addressing flagged issues (optimizing images, minimizing JavaScript, improving server response, etc.) will yield faster, more reliable sites. Keeping track of performance over time (with monitoring tools) helps catch regressions early. By leveraging these specialized speed tests, developers and site owners can systematically improve page load times and user experience.