


Netdata is a popular open-source monitoring tool used for real-time server and VPS performance monitoring. With over 76,000 stars on GitHub, it has become a trusted choice among developers and system administrators, largely due to its simplicity and depth of insight.
In this guide, you’ll learn how to install Netdata on an Ubuntu VPS and use it to monitor your system’s performance in real time.
What Is Netdata?
Netdata is a real-time performance monitoring agent that runs directly on a server or VPS.
It continuously collects system metrics such as CPU usage, memory consumption, disk activity, network traffic, and process behavior, and presents them through a live web-based dashboard. Metrics update every second, allowing administrators to observe changes as they happen.
On an Ubuntu VPS, Netdata provides immediate visibility into how system resources are being used, helping identify bottlenecks, abnormal activity, and performance limits without requiring complex configuration.
Prerequisites
-
An Ubuntu 22.04 or 24.04 VPS
-
Root or sudo access on the server
-
Outbound internet access to download Netdata
Installing Netdata on Ubuntu
This section covers installing Netdata on an Ubuntu VPS and confirming that the service is running correctly.
Install Netdata using the official kickstart script
First, update the package list to ensure the system is aware of the latest available packages:
sudo apt updateInstall curl, which is required to download the Netdata installation script:
sudo apt install -y curlNext, run the official Netdata kickstart script to install the Netdata agent:
sudo bash -c "$(curl -SsL https://my-netdata.io/kickstart.sh)" -- --install-type anyThis script installs Netdata, resolves dependencies, and configures it to start automatically.
What the installation sets up
After installation, Netdata sets up the following:
-
A netdata systemd service running in the background
-
The Netdata web dashboard is listening on port 19999
-
An official Netdata package repository for future updates
Verify Netdata is running
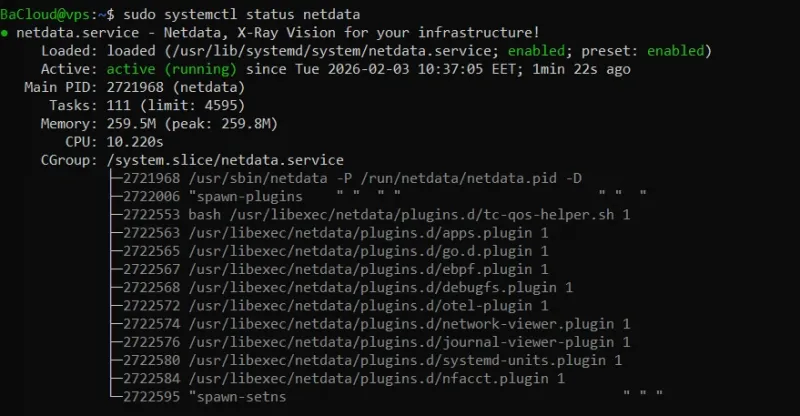
Use systemd to confirm that the Netdata service is active:
sudo systemctl status netdataIf the service status shows active (running), like in the image below, then Netdata is installed correctly and collecting metrics.
Accessing the Netdata Dashboard
This section explains how to reach the Netdata web dashboard and confirm that it is displaying live system metrics.
Default dashboard URL and port
By default, Netdata makes its dashboard available on port 19999.
If you are accessing the VPS locally, open a browser and go to:
http://localhost:19999You should see the Netdata welcome page, like in the image below:
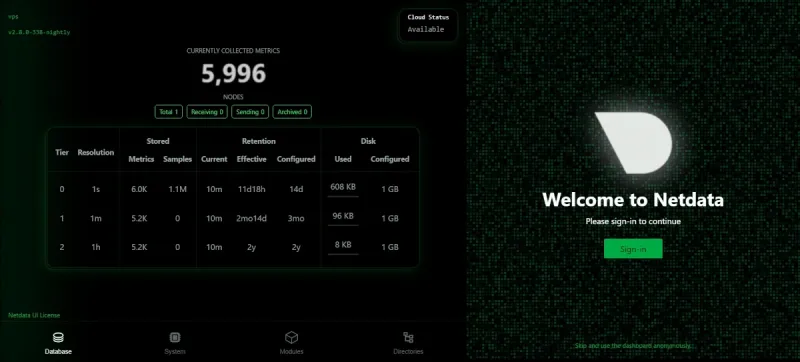
You can choose to sign in or view the dashboard anonymously.
If you are accessing the VPS from another machine, use the server’s public IP address:
http://<your_vps_ip>:19999Note: On most VPS setups, the firewall may block port 19999 by default. To allow temporary testing:
sudo ufw allow 19999
sudo ufw reload
For security, it is safer to use SSH port forwarding instead (explained in the next section: Securing the Netdata Dashboard).
Verify metrics are updating in real time
After the dashboard loads (as shown in the screenshot), the charts should update continuously. CPU, memory, disk, and network graphs reflect your VPS’s real-time activity.
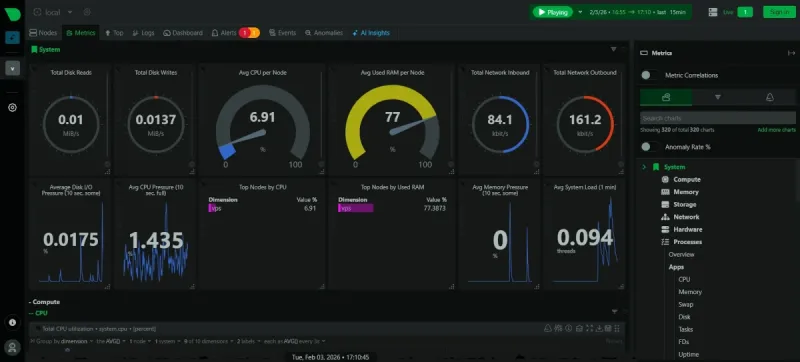
If the charts appear static, verify that the Netdata service is running.
Securing the Netdata Dashboard
This section explains how to access the Netdata dashboard securely on a VPS without exposing it to the public internet.
Why exposing Netdata publicly is a risk
The Netdata dashboard exposes detailed system metrics and process information. Making it publicly accessible increases the attack surface and reveals internal system activity.
SSH port forwarding (recommended)
SSH port forwarding allows secure access to the Netdata dashboard without opening any additional ports.
From your local machine, create an SSH tunnel to the VPS:
ssh -L 19999:localhost:19999 user@your_vps_ipThis command forwards local port 19999 to port 19999 on the VPS over an encrypted SSH connection.
Once connected, open the dashboard locally at:
http://localhost:19999Restricting access with UFW (secondary option)
If UFW is enabled, ensure that Netdata’s port is not open to the public.
Check the current firewall rules:
sudo ufw statusThis command displays whether port 19999 is currently allowed or blocked.
If the port is exposed, deny public access:
sudo ufw deny 19999This rule prevents external connections to the Netdata dashboard.
Notes
-
Do not leave port 19999 open to the internet
-
Do not rely on obscurity or unprotected IP access
-
Do not expose the dashboard without authentication
Key VPS Metrics to Monitor in Netdata
In this section, you’ll see the most important metrics to watch for maintaining VPS health.
CPU usage and load averages: Monitor CPU usage to see how much processing power is being used. Load averages show how many processes are competing for CPU over time. Sustained high CPU or load values can indicate performance bottlenecks or runaway processes.
Memory and swap usage: Check memory consumption to ensure the system is not running out of RAM. Swap usage indicates that the system is moving data from RAM to disk, which can slow performance. High swap activity often signals memory pressure.
Disk usage and I/O: Watch disk usage to avoid running out of storage. Disk I/O metrics show read and write activity; high I/O or slow response times can affect applications and databases.
Network throughput and errors: Track network traffic to detect unexpected spikes or drops. Errors or dropped packets may indicate misconfigured services, network issues, or potential abuse.
System uptime and basic process activity: Monitor system uptime and the number of active processes. Frequent restarts, crashes, or abnormal process counts can indicate instability or resource issues.
Identifying Resource Usage by Process
Netdata lets you see which processes and services are using the most system resources, helping pinpoint performance issues quickly.
Per-process CPU and memory usage: The dashboard shows CPU and RAM usage for each process in real time. Sorting by usage makes it easy to identify the applications consuming the most resources.
Identifying heavy processes: Processes that consistently use high CPU, memory, or disk I/O can indicate misconfiguration, inefficient workloads, or unusual activity. Netdata helps determine whether an issue is system-wide or tied to a specific process.
Monitoring common VPS services: Netdata automatically detects and monitors common services:
-
Web servers – request activity and resource usage for Nginx or Apache
-
Databases – performance metrics for MySQL or PostgreSQL
-
Containers – container-level resource usage for Docker
Seeing per-process and service metrics in real time reduces guesswork, letting you quickly link performance problems to the responsible processes.
Basic Alerts
This section explains how Netdata alerts work and when they are useful for VPS monitoring.
How Netdata health alerts work
Netdata includes built-in health alerts that monitor system metrics against predefined thresholds. When a metric exceeds a warning or critical level, Netdata generates an alert that appears in the dashboard.
Where alerts are configured
Alert rules are stored in Netdata’s health configuration directory:
cd /etc/netdata/health.d/This command moves into the directory where default alert definitions are stored.
You can view available alert configuration files using:
lsThis command lists the alert rule files that Netdata uses to monitor system health.
When alerts are useful on a VPS
Alerts are useful when the dashboard is not monitored continuously. They provide early warning of resource limits or performance issues that could affect service availability.
For most VPS deployments, the default alert rules provide sufficient basic monitoring without additional configuration.
Conclusion
Netdata offers a simple and effective way to monitor VPS performance in real time, giving visibility into CPU, memory, disk, and network activity. With this tutorial, you now have the setup and guidance to monitor your VPS effectively, maintain system health, and quickly identify performance bottlenecks, while more advanced monitoring platforms can be considered as needs grow.
For more in-depth tutorials, visit the BaCloud blog, where you’ll find helpful guides.